by Amanda Lister
Just as modern technology has replaced paperback books with e-books, and checking out books from the library into surfing the web, ReadWriteThink.org has improved the traditional paper form of a Venn diagram to an online interactive tool.
Online Venn Diagram Tool for Many Grade Levels
The Venn Diagram interactive can be used by students in grades K–12, but is ideal for the elementary and middle school levels. This interactive tool is an excellent way to engage students in learning by integrating technology into the classroom. The tool allows students to create Venn diagrams that contain two or three overlapping circles while identifying and recording concepts learned in their lessons. Teachers can use this interactive tool across content areas, and students can demonstrate their comprehension of a topic and exhibit their ability to identify and compare information.
Also, the mobile app version of the Venn Diagram interactive is available for iOS and Adroid.
How to Use the Venn Diagram Interactive
The Venn Diagram interactive is easy for students to use and understand.
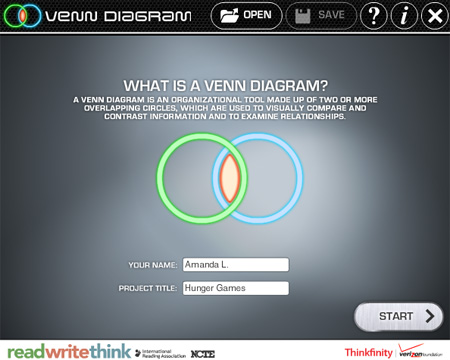
First, students are prompted to write their name in the first field. Underneath the name is a field for the project title, which allows up to 20 characters. If they’re unsure about what they want to title the project before they’ve created it, don’t worry; they can change the title at any time throughout the process.

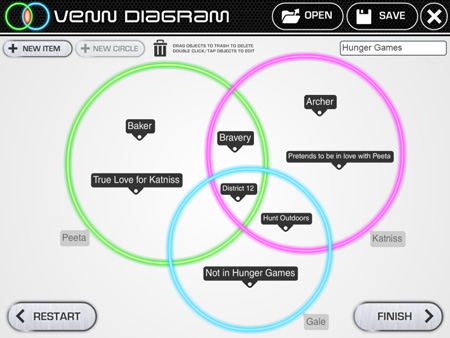
Once student have filled out their name and a title for their Venn diagram, the interactive tool automatically creates the diagram starting with two circles. The two circles default to being labeled as “Circle 1” and “Circle 2.” Students can change the circle labels to anything they would like relating to their topic by double-clicking on the title or any part of the circle. In this example, the Venn diagram represents a comparison of characters from the ever-popular book series, The Hunger Games.

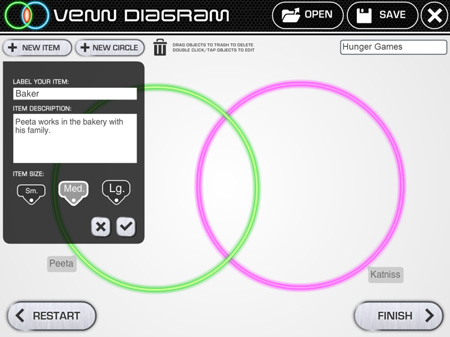
To start adding information inside of the Venn diagram, students can click the tab “+ New Item” in the top left corner of the screen. First they choose a label for their item, which can then be placed inside one or both of the circles, depending on how it applies to the two topics they are comparing. Underneath the label, students have the option of adding an item description. This additional text helps to provide a more explicit understanding of the item, and shows up as a footnote on a separate page of the completed diagram. On the bottom of this tab, they also have the option of choosing a size for the item, including small, medium, and large. Younger kids placing only a few items may choose large, while older students may choose medium or small to be able to fit more items on the diagram.

Easily Adding a Third Circle
Although some Venn diagrams may only need two circles to adequately represent their topic, more complex Venn diagrams may need three. Students can simply click the “+ New Circle” tab in the top left corner of the page to add another circle and use the same steps as listed above to customize it. Once the third circle is created, students may need to reposition or resize the two existing circles (by simply clicking on the circle and dragging it, or clicking the black tab with the arrows to resize) or repositioning or resizing items inside the circles. The interactivity of the tool makes all of these adjustments easy to do.

Save for Later, Share, or Print
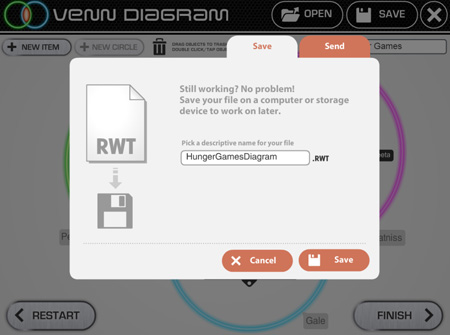
Once they are satisfied with the diagram, students can click on the “Save” button in the top right corner of the page. If they are not finished or want to work on it in the future, one of the options is to save the file to a computer or storage device as a draft or “working version.” This functionality enables students to save their progress and reflect on their work, at times after discussing it with their teachers.
Students can also print and e-mail their draft version if saving to a device is not possible.

In addition, once students are finished working, they can similary save, print, or e-mail the final versions of their Venn Diagrams. The Venn diagram will print on page 1, with footnotes printing on page 2.
Lesson Plan Ideas
Venn Diagram is a highly customizable tool and can be as interactive as you want it to be. Students can work on their diagrams individually or in groups, and teachers can display the tool on their whiteboards for an in-class exercise. Students will not only learn from the Venn Diagram interactive, but they will have fun doing it.
With this interactive, students learn to identify specific concepts while organizing their information logically. ReadWriteThink.org—a website produced by the International Reading Association and the National Council of Teachers of English, with support from the Verizon Foundation—has dozens of lesson plan ideas that feature Venn diagrams.
For students in grades 3-4, try “Behind the Scenes with Cinderella” submitted byCarol L. Butterfield from Ellensburg, Washington. In her lesson plan, Students compare the classic tale of Cinderella with a version set in the pre-Civil War South, Moss Gown by William Hooks, noting the architecture, weather, time period, and culture as depicted in the text and illustrations.
Grade 6-8 teachers can try “The Big Bad Wolf: Analyzing Point of View in Texts” created by Laurie A. Henry, Ph.D., from Lexington, Kentucky. Students look at the author's purpose, examine multiple viewpoints, and also recognize gaps in the text by comparing different versions of the Big Bad Wolf story.
High school teachers can use “Critical Literacy: Women in 19th Century Literature” by Elizabeth Nolan Conners from Weston, Massachusetts. In this lesson, students compare authors’ purpose and voice from two types of literature from the mid-1800s depicting women.
Share Your Thoughts, Submit Your Ideas
We encourage teachers using ReadWriteThink’s Venn Diagram interactive to submit their feedback and lesson plan ideas to the ReadWriteThink staff.
Amanda Lister is a strategic communications intern at the International Reading Association.